A statement that roughly one-quarter of lost weight was lean mass can sound like a statement that someone lost one-quarter of their muscles. Those are very different claims. In the SURMOUNT-1 body-composition substudy, tirzepatide reduced both fat and lean tissue, but the widely discussed 75/25 split describes the composition of weight lost—not the percentage of starting muscle that disappeared.
The study offers useful evidence beyond a bathroom scale: paired body-composition measurements over 72 weeks, a placebo comparison, and separate estimates for fat and lean mass. It does not directly establish changes in muscle strength. This analysis draws on the full body-composition article, its publisher correction, the indexed primary-report abstracts for the parent trial and a heart-failure comparison, and official FDA material. These sources answer different questions and should not be treated as interchangeable.
At a glance
- Analysis population
- The DXA analysis included 160 participants: 124 receiving pooled tirzepatide doses and 36 receiving placebo; approximately 73% were female.Sources: [1]
- Changes from baseline
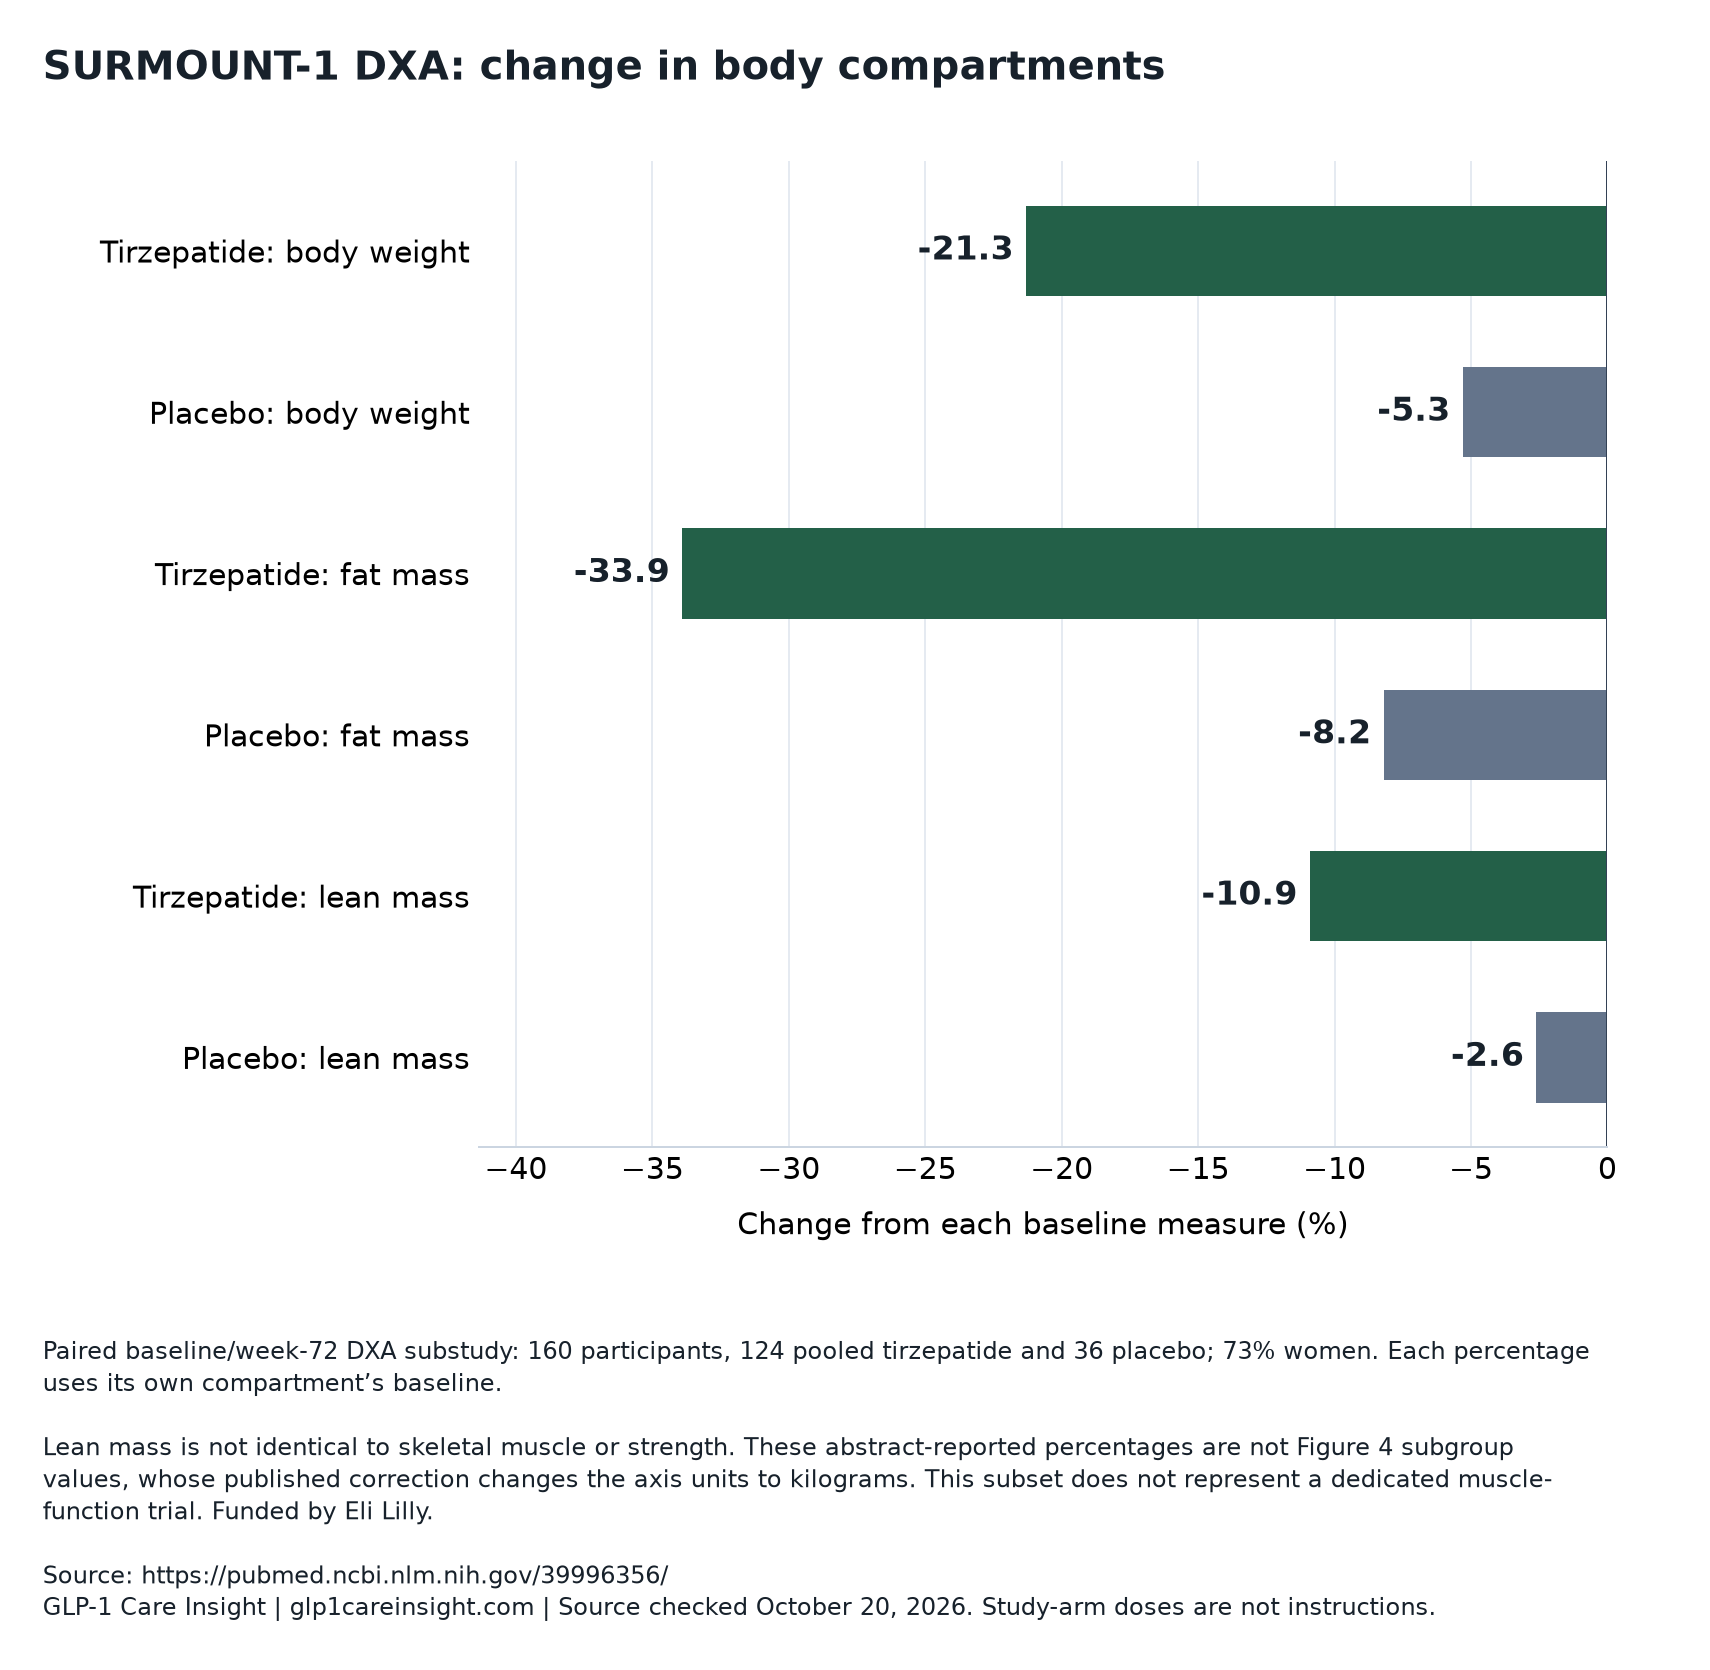
- At 72 weeks, weight, fat mass, and lean mass changed by −21.3%, −33.9%, and −10.9% with tirzepatide, versus −5.3%, −8.2%, and −2.6% with placebo.Sources: [1]
- Share of weight lost
- Approximately 75% of lost weight was fat and 25% was lean mass in both groups. This is not a measurement of the percentage of starting muscle lost.Sources: [1]
- Corrected figure units
- An August 2025 correction changed Figure 4’s fat-mass and lean-mass axis units to kilograms, not percent; it did not change the abstract’s percentage changes.Sources: [3]
- Safety context
- In the parent trial, gastrointestinal adverse events were most common. Adverse events caused discontinuation in 4.3%–7.1% of tirzepatide participants across dose groups, versus 2.6% with placebo.Sources: [2]
A small imaging study nested inside a larger randomized trial
SURMOUNT-1 randomized 2,539 adults without diabetes who had obesity, or overweight with at least one weight-related complication. Participants received once-weekly subcutaneous tirzepatide at assigned doses of 5, 10, or 15 mg, or placebo, for 72 weeks, including a 20-week escalation period. These doses identify research arms, not instructions for treatment. Both groups received lifestyle counseling; the comparator was not an absence of care.
The imaging substudy enrolled 255 participants at 28 sites with suitable scanners. Its efficacy analysis included 160 with baseline and follow-up DXA measurements, including scans at early discontinuation where applicable. Their mean age was 46.2 years, starting weight 102.5 kg, and BMI 38.0; 73.1% were female and 75.6% were White. Thus, the frequently cited 160 is the paired-measurement analysis population, not everyone initially enrolled.
The substudy’s primary objective was percentage change in fat mass with the three tirzepatide groups pooled versus placebo. Lean-mass changes were secondary endpoints. Pooling improves the amount of information available for that comparison but does not produce a precise, separate body-composition estimate for each dose.
DXA measures tissue compartments—not muscle performance
Dual-energy X-ray absorptiometry, or DXA, estimates body composition using X-rays at two energy levels. Here, fat mass represents estimated fat molecules, while lean mass means nonfat soft tissue excluding bone mineral content. Lean mass includes skeletal muscle, but also organs, water, and other tissues. Calling every kilogram of DXA lean-mass loss a kilogram of muscle loss would overstate what the instrument establishes.
The investigators used Hologic or GE HealthCare/Lunar scanners and a blinded central reader. Instructions called for each participant’s scans to use the same scanner and software under similar conditions, including hydration, positioning, and time of day. These precautions help make repeated measurements comparable; they do not turn DXA into a direct assessment of muscle quality, force production, or mobility.
The distinction matters clinically and scientifically. A tissue measurement asks how much material is present. A strength test asks what a person can produce, while a walking test measures integrated performance. Those outcomes can move differently. A consultation can therefore distinguish composition concerns from functional concerns rather than treating them as synonyms; the consultation-question guide can help organize that discussion.
STUDY DATA · GLP-1 Care Insight
SURMOUNT-1 DXA: change in body compartments
Paired baseline/week-72 DXA substudy: 160 participants, 124 pooled tirzepatide and 36 placebo; 73% women. Each percentage uses its own compartment’s baseline.
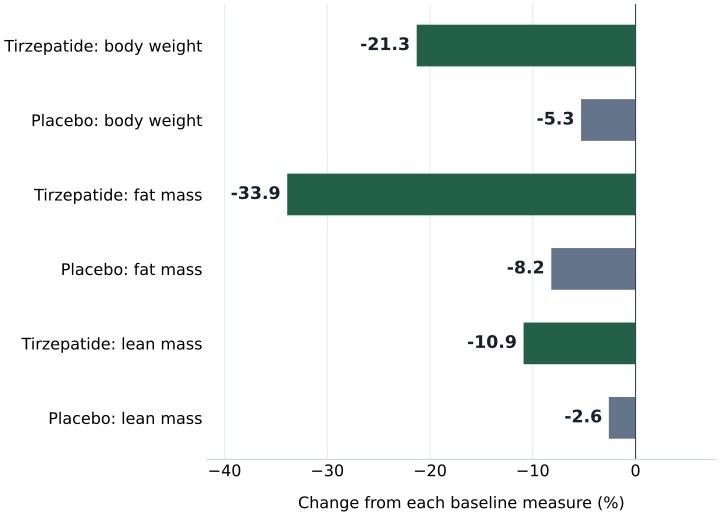
| Study group | Change from each baseline measure (%) |
|---|---|
| Tirzepatide: body weight | -21.3 |
| Placebo: body weight | -5.3 |
| Tirzepatide: fat mass | -33.9 |
| Placebo: fat mass | -8.2 |
| Tirzepatide: lean mass | -10.9 |
| Placebo: lean mass | -2.6 |
Lean mass is not identical to skeletal muscle or strength. These abstract-reported percentages are not Figure 4 subgroup values, whose published correction changes the axis units to kilograms. This subset does not represent a dedicated muscle-function trial. Funded by Eli Lilly.
Original visualization of published aggregate data. No individual prediction or provider performance is represented. Original research ↗
The results depend on which starting quantity is the denominator
The main percentage results use three different starting quantities. Weight change is divided by starting body weight, fat change by starting fat mass, and lean change by starting lean mass. Consequently, a 33.9% fat reduction and a 10.9% lean reduction should not be added together to calculate weight loss. Their denominators differ.
The estimated between-group difference in fat change was −25.7 percentage points, with a 95% confidence interval from −31.4 to −20.0. For lean mass, it was −8.3 percentage points, with a confidence interval from −10.6 to −6.1. These intervals describe uncertainty around estimated average treatment differences under the analysis model; they are not ranges within which every participant’s response fell.
In absolute terms, modeled average losses were 15.9 kg of fat and 5.6 kg of lean mass with tirzepatide, versus 3.6 kg and 1.2 kg with placebo. The corresponding differences were −12.3 kg for fat, with a 95% confidence interval of −15.1 to −9.6, and −4.4 kg for lean mass, with an interval of −5.6 to −3.2.
| Measure | Pooled tirzepatide | Placebo |
|---|---|---|
| Body weight | −21.3% | −5.3% |
| Fat mass | −33.9% | −8.2% |
| Lean mass | −10.9% | −2.6% |
The 75/25 split describes lost tissue, not starting muscle
For the proportional calculation, the report divided fat loss by the sum of fat and lean loss, with an analogous calculation for lean loss. Its detailed results were 74% fat and 26% lean with tirzepatide, versus 75% and 25% with placebo. The abstract reasonably summarizes both as approximately 75/25. This is a different calculation from percentage change relative to baseline.
A hypothetical example makes the denominator clear: if measured fat-plus-lean loss totals 20 kg, a 75/25 split corresponds to 15 kg of fat and 5 kg of lean tissue. It says nothing by itself about the percentage of starting lean tissue lost. That requires knowing starting lean mass. Nor does the 5 kg identify how much skeletal muscle, rather than other lean tissue, changed.
Similar proportions also do not mean similar amounts. Tirzepatide participants lost much more total weight, so a comparable lean share accompanied a larger absolute lean loss. The scientifically defensible conclusion is that the average proportional split resembled placebo—not that lean tissue was unchanged or that every participant had the same split.
| Calculation | Denominator | Meaning |
|---|---|---|
| Lean-mass change from baseline | Starting lean mass | How much the measured lean compartment changed relative to its initial size |
| Lean share of lost tissue | Fat loss plus lean loss | How much of the combined measured tissue loss was lean |
| Body-weight change from baseline | Starting body weight | How much total weight changed relative to starting weight |
A corrected figure should not be read as a percentage chart
The publisher issued a correction on August 20, 2025: Figure 4’s fat-mass and lean-mass vertical axes should be labeled in kilograms, not percent. That figure compares participants grouped by how much weight they lost. Reading a kilogram value as a percentage would change its meaning and could produce an incorrect claim about the fraction of starting tissue lost.
The correction concerns those figure labels, not the baseline percentage changes in the abstract. The percentage table above therefore uses the abstract’s −33.9% fat and −10.9% lean changes, rather than converting or reproducing the mislabeled figure. A useful habit when evaluating any chart is to identify the unit, denominator, population, and time point before interpreting the height of a bar.
Why the parent trial reports different weight-loss numbers
The parent SURMOUNT-1 abstract reports average weight changes of −15.0%, −19.5%, and −20.9% in the 5-, 10-, and 15-mg groups, respectively, versus −3.1% with placebo. The corresponding 95% confidence intervals were −15.9 to −14.2, −20.4 to −18.5, −21.8 to −19.9, and −4.3 to −1.9. Those are separate dose groups in the much larger trial, not the pooled DXA subset.
The parent trial’s coprimary endpoints were percentage weight change and the proportion losing at least 5% of starting weight. Its treatment-regimen estimand—its specified way of defining the treatment effect—assessed outcomes regardless of treatment discontinuation. The DXA analysis instead required available paired scans and used its own statistical models. Differences in population, dose pooling, and handling of treatment participation make its −21.3% estimate a different result, not a contradiction.
The imaging article also discusses efficacy-oriented parent-trial estimates that differ from the indexed abstract’s treatment-regimen results. Readers should avoid choosing whichever number looks largest without its analytic context. The guide to interrogating advertised percentages provides a framework; the direct-comparison study explainer addresses a separate design, not a head-to-head answer from this substudy.
Fat distribution changed, but downstream benefits were not measured here
Tirzepatide participants also had an estimated 40.1% reduction in visceral fat, versus 7.3% with placebo. The between-group difference was −32.8 percentage points, with a 95% confidence interval of −42.8 to −22.8. Waist circumference fell by 18.1 cm versus 3.4 cm, a difference of −14.7 cm with an interval of −18.5 to −11.0.
Visceral fat is fat within the abdominal region, but this study estimated it through manufacturer software rather than measuring it directly with computed tomography. The algorithm used the lower 20% of the trunk region and distinguished estimated visceral from subcutaneous fat. These results add information about fat distribution beyond total weight, without directly measuring a change in cardiovascular events or other long-term clinical outcomes.
It would also be premature to claim that a particular compartment change caused improved health. The substudy did not randomize people to different amounts of visceral-fat loss or lean loss. It observed changes following randomized treatment, which supports a treatment comparison but does not isolate which tissue change explains any broader benefit.
Function needs its own evidence
The body-composition article cites improved patient-reported physical function in the broader SURMOUNT-1 population despite lean-mass reductions. That is relevant, but self-reported function is not an objective strength test. The DXA analysis did not establish how much grip strength, chair-rise performance, or muscle power changed alongside each participant’s lean mass.
A different trial illustrates the distinction. STEP-HFpEF randomized 529 people with obesity and heart failure with preserved ejection fraction to weekly semaglutide 2.4 mg or placebo for 52 weeks. Its dual primary endpoints were a heart-failure symptom and limitation score and body-weight change. The between-group symptom-score difference was 7.8 points, with a 95% confidence interval of 4.8 to 10.9; the six-minute walking-distance difference was 20.3 meters, with an interval of 8.6 to 32.1.
Those findings concern another medicine, disease population, and endpoint set. They cannot supply missing strength data for tirzepatide’s DXA participants or prove that lean loss is harmless. They show why performance deserves direct measurement. The STEP-HFpEF explainer examines that separate evidence; its primary report is available here as an indexed abstract, not an examined full protocol or supplement.
Missing scans and exploratory subgroups limit precision
Only 160 of the 255 enrolled imaging participants entered the paired-scan efficacy analysis. Requiring usable follow-up measurements can limit representativeness if people without them differ meaningfully from those analyzed. Three missing week-72 values were filled using the last available observation. That method preserves an earlier measurement rather than observing what actually happened at week 72.
The investigators adjusted continuous-outcome comparisons for baseline measurements. They did not adjust for multiple testing, and analyses by age, sex, and weight-loss category were post hoc, meaning conducted after the main analysis plan rather than serving as the primary test. Broadly similar proportions across most subgroups are informative, but small groups cannot confidently exclude clinically important differences, particularly among older or functionally vulnerable adults.
The study also did not analyze nutrient intake or physical activity in relation to DXA changes and included no specific strength-training protocol. It therefore cannot identify which nutrition or exercise strategy preserves lean tissue during treatment. Eli Lilly funded the work and participated in design, data collection, analysis, interpretation, reporting, and submission; several authors were employees and shareholders. These disclosures matter alongside the study’s methodological strengths and limits.
Safety and product identity remain separate questions
In the parent trial’s indexed abstract, gastrointestinal adverse events were the most common with tirzepatide, generally mild to moderate and concentrated during escalation. Adverse events led to discontinuation in 4.3%, 7.1%, and 6.2% of the three dose groups, compared with 2.6% with placebo. These are treatment-discontinuation percentages, not the overall incidence of adverse events, and favorable composition results do not cancel them.
The findings also do not establish equivalence for compounded preparations, oral products, or other formulations. FDA states that compounded drugs are not FDA approved or reviewed before marketing for safety, effectiveness, or quality, and identifies concerns including dosing errors. Spontaneous reports alone cannot establish event rates or causation. The medication-identity guide helps separate product questions from claims about trial outcomes.
Editorial interpretation: a program’s use of the 75/25 statistic is not evidence that its service preserves muscle or reproduces trial results. Documentary terms should be checked separately from biological claims. A CoreAge Rx documentary review can support checking those terms; that invitation does not imply availability of the studied product, condition-specific care, or comparable outcomes.
Questions & answers
Does the study mean participants lost 25% of their muscles?
No. Approximately one-quarter of the combined fat and lean tissue lost was lean mass. The average lean-mass reduction relative to starting lean mass was 10.9% with tirzepatide. Neither number directly measures skeletal muscle loss because DXA lean mass includes water, organs, and other nonfat soft tissue as well as muscle.
Can someone have a higher lean-mass percentage while losing lean tissue?
Yes. As a mathematical interpretation, if fat falls faster than lean tissue, lean tissue can become a larger share of the remaining body even while its absolute amount decreases. That is why kilograms, percentage change from baseline, and percentage of current body weight answer different questions. A favorable ratio does not demonstrate that no lean tissue was lost.
Did the placebo comparison prove tirzepatide has no muscle-related downside?
No. The average proportional split was similar, but absolute lean loss was greater with tirzepatide, and the substudy lacked direct strength or physical-performance endpoints. It supports a narrower conclusion about the composition of lost tissue. Establishing consequences for vulnerable individuals requires measurements and populations designed to answer that question.
Can these results determine a personal protein or exercise target?
No. The analysis did not test specific protein strategies or a strength-training intervention, nor relate measured nutrient intake and activity to composition outcomes. It can motivate discussion of nutrition, activity, and function, but it cannot establish a particular regimen as the explanation for—or solution to—the observed lean-mass changes.
What information would most improve the interpretation?
Larger studies with repeated tissue measurements, direct strength and performance tests, and better representation of older or functionally vulnerable adults would help. Measuring intake and activity alongside these outcomes could clarify why responses vary. Follow-up beyond 72 weeks would also address whether composition and function evolve differently during continued treatment or later weight changes.
Our assessment
SURMOUNT-1’s DXA substudy provides convincing evidence of substantially greater fat loss, accompanied by greater lean-mass loss, with pooled tirzepatide than with placebo over 72 weeks. Its approximate 75/25 split is useful only when the denominator is stated. The result does not mean one-quarter of starting muscle disappeared, but neither does it establish preserved strength. The most informative next step scientifically is to connect tissue changes with directly measured function, especially in people whose functional reserve is limited.
Sources & documentation
Scientific and official sources consulted October 20, 2026. Study findings apply to the populations, products and time periods described; they are not provider outcome data.
- Body composition changes during weight reduction with tirzepatide in the SURMOUNT-1 study of adults with obesity or overweight. ↗
- Tirzepatide Once Weekly for the Treatment of Obesity. ↗
- Correction to "Body composition changes during weight reduction with tirzepatide in the SURMOUNT-1 study of adults with obesity or overweight". ↗
- Semaglutide in Patients with Heart Failure with Preserved Ejection Fraction and Obesity. ↗
- FDA concerns about unapproved GLP-1 drugs ↗